Monitor your APIs with Prometheus
Last updated: 4 minutes read.
Introduction
Your Tyk Pump can expose Prometheus metrics for the requests served by your Tyk Gateway. This is helpful if you want to track how often your APIs are being called and how they are performing. Tyk collects latency data of how long your services take to respond to requests, how often your services are being called and what status code they return.
We have created a demo project in GitHub if you want to see this setup in action.
Prerequisites
- A Tyk installation (either Self-Managed or Open Source Gateway)
- Tyk Pump 1.6 or higher
Configure Tyk Pump to expose Prometheus metrics
Prometheus collects metrics from targets by scraping metrics HTTP endpoints. To expose Tyk’s metrics in the Prometheus format, you need to add the following lines to your Tyk Pump configuration file pump.conf:
Option 1 - on a host

"prometheus": {
 "type": "prometheus",
 "meta": {
   "listen_address": "<tyk-pump>:9090",
   "path": "/metrics",
   "custom_metrics":[
     {
         "name":"tyk_http_requests_total",
         "description":"Total of API requests",
         "metric_type":"counter",
         "labels":["response_code","api_name","method","api_key","alias","path"]
     },
     {
         "name":"tyk_http_latency",
         "description":"Latency of API requests",
         "metric_type":"histogram",
         "labels":["type","response_code","api_name","method","api_key","alias","path"]
     }
 ]
 }
}
Replace <tyk-pump> with your host name or IP address.
Option 2 - with Docker
"prometheus": {
 "type": "prometheus",
 "meta": {
   "listen_address": ":9090",
   "path": "/metrics",
   "custom_metrics":[
     {
         "name":"tyk_http_requests_total",
         "description":"Total of API requests",
         "metric_type":"counter",
         "labels":["response_code","api_name","method","api_key","alias","path"]
     },
     {
         "name":"tyk_http_latency",
         "description":"Latency of API requests",
         "metric_type":"histogram",
         "labels":["type","response_code","api_name","method","api_key","alias","path"]
     }
 ]
 }
}
Port 9090 needs also to be exported by Docker in addition to the port used for health check (here 8083), e.g. with Docker compose:
tyk-pump:
   image: tykio/tyk-pump-docker-pub:${PUMP_VERSION}
   ports:
   - 8083:8083
   - 9090:9090
Restart your Pump to apply to configuration change.
Verify that the metrics are being exposed by calling the metrics endpoint http://<tyk-pump>:9090 from your browser.
Configure Prometheus to scrape the metrics endpoint
Prometheus is configured via a configuration file where you can define the metrics endpoint Prometheus will scrape periodically.
Here’s an example configuration scraping Tyk Pump metric endpoints:
Option 1 - on a host
global:
 scrape_interval:     15s
 evaluation_interval: 15s

scrape_configs:
 - job_name: tyk
   static_configs:
     - targets: ['tyk-pump:9090']
Option 2 - with Docker
global:
 scrape_interval:     15s
 evaluation_interval: 15s

scrape_configs:
 - job_name: tyk
   static_configs:
     - targets: ['host.docker.internal:9090']
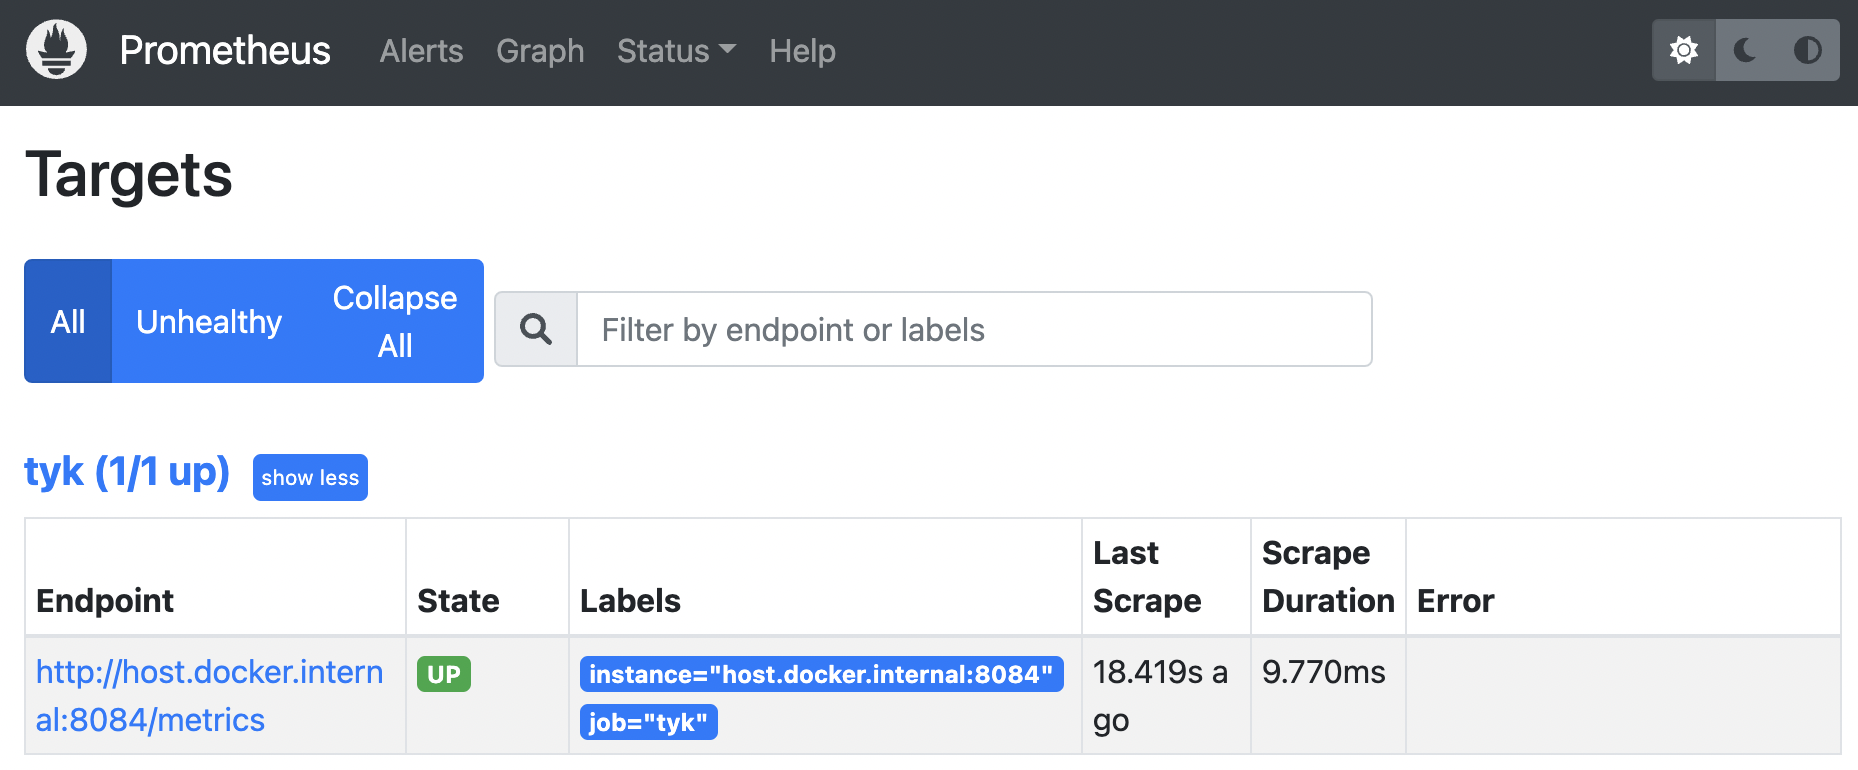
- Then restart your Prometheus instance after any configuration change
- In Prometheus under “Status” / “Targets”, we can see that Prometheus is able to scrape the metrics successfully: state is UP.
Exploring your metrics in Grafana
Before trying out, make sure to generate traffic by calling your APIs. You will find a couple of useful queries in our Tyk Pump GitHub repo based on the metrics exposed by Tyk. These will demonstrate which metric types are exported and how you can customise them.
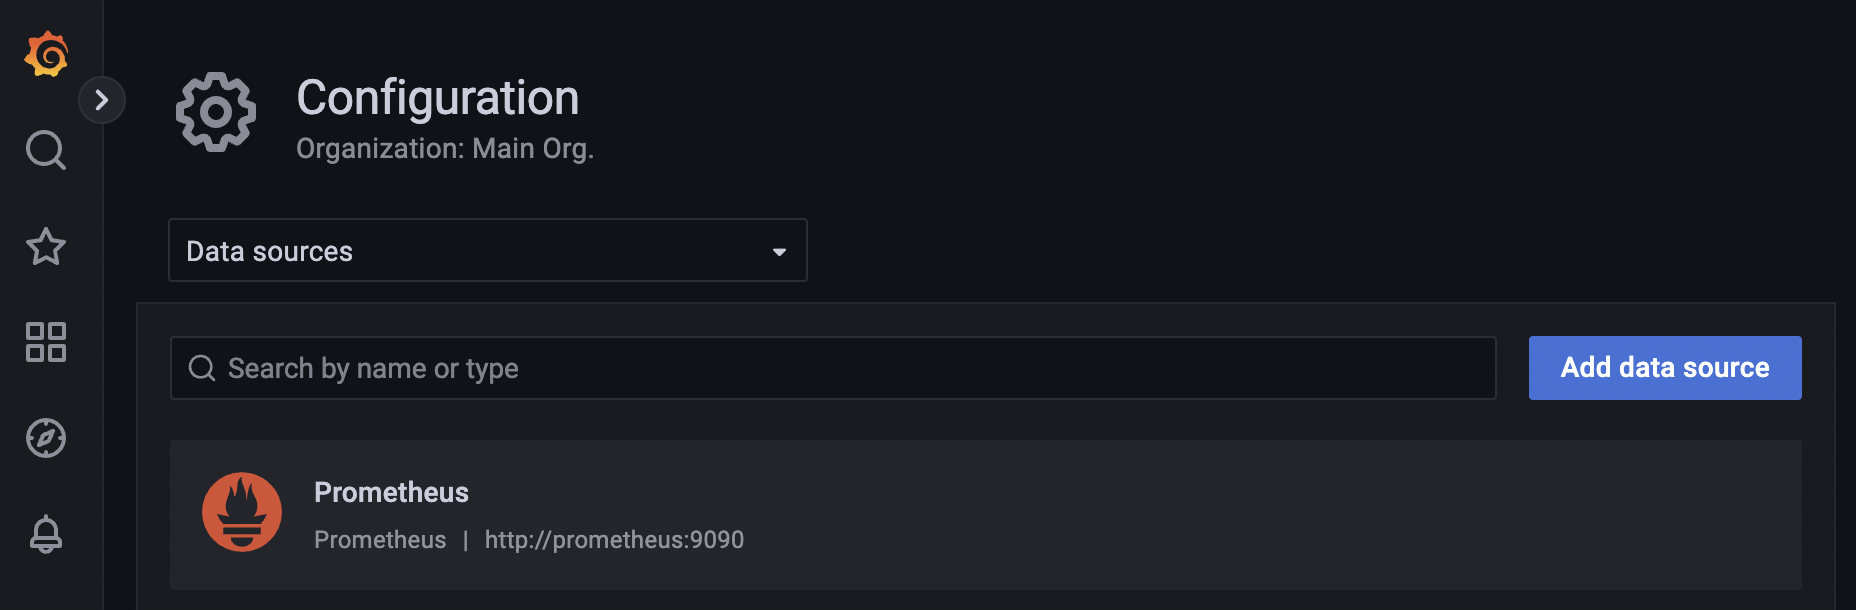
You also need to make sure that Grafana is connected to your Prometheus server. This can be configured under Configuration / Data sources
Useful queries
Here are some useful queries to help you monitor the health of your APIs:
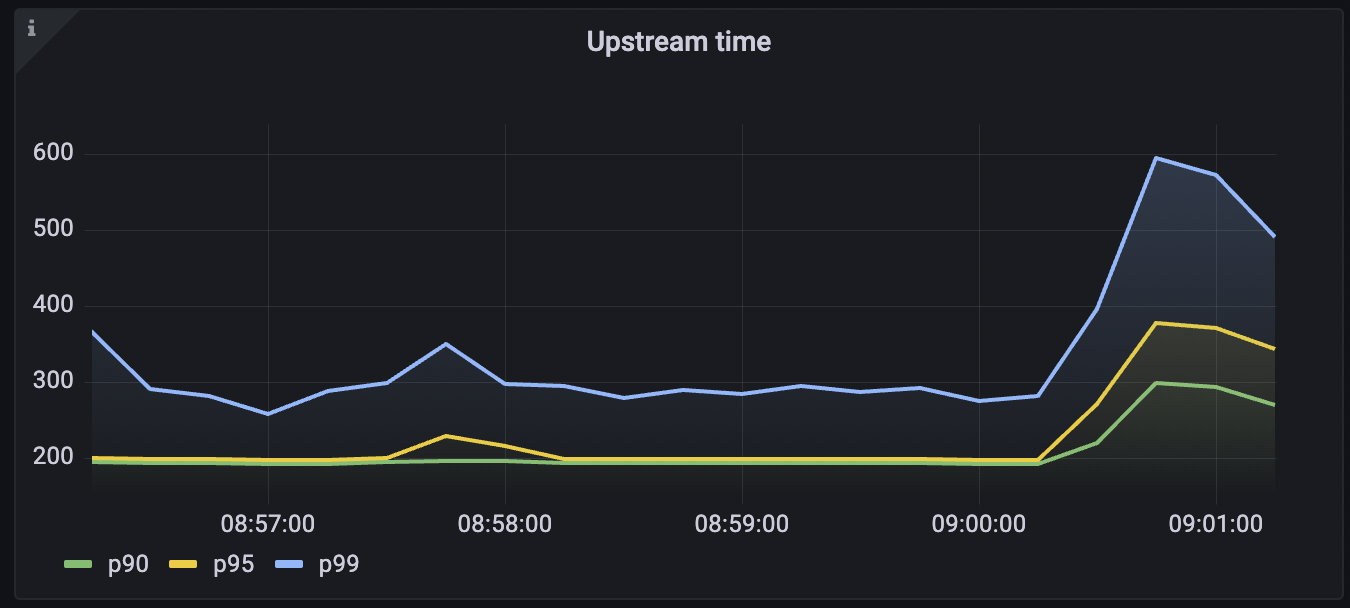
Upstream time across all services
Tyk collects latency data of how long your upstream services take to respond to requests. This data can be used to configure an alert if the latency goes beyond a certain threshold. This query calculated the 95th percentile of the total request latency of all the upstream services. To run the query:
histogram_quantile(0.95, sum(rate(tyk_http_latency_bucket[1m])) by (le))
Upstream time per API
This query calculated the 95th percentile of the request latency of upstream services for the selected API. To run this query:
histogram_quantile(0.90, sum(rate(tyk_http_latency_bucket{api_name="<api name>"}[1m])) by (le,api_name))
Replace <api name> with the name of your API for this query.
Request rate
Track the request rate of your services:
sum (rate(tyk_http_requests_total[1m]))
Request Rate per API
Track the request rate of your services for the selected API:
sum (rate(tyk_http_requests_total{api_name="<api name>"}[1m]))
Replace <api name> with the name of your API for this query.
Error Rates
Track the error rate your services are serving:
sum (rate(tyk_http_requests_total{response_code =~"5.."}[1m]))
Error rates per API
Track the error rate your services are serving for the selected API:
sum (rate(tyk_http_requests_total{response_code =~"5..", api_name="httpbin - HTTP Request & Response Service"}[1m]))
Replace <api name> with the name of your API for this query.